Home > Case Studies
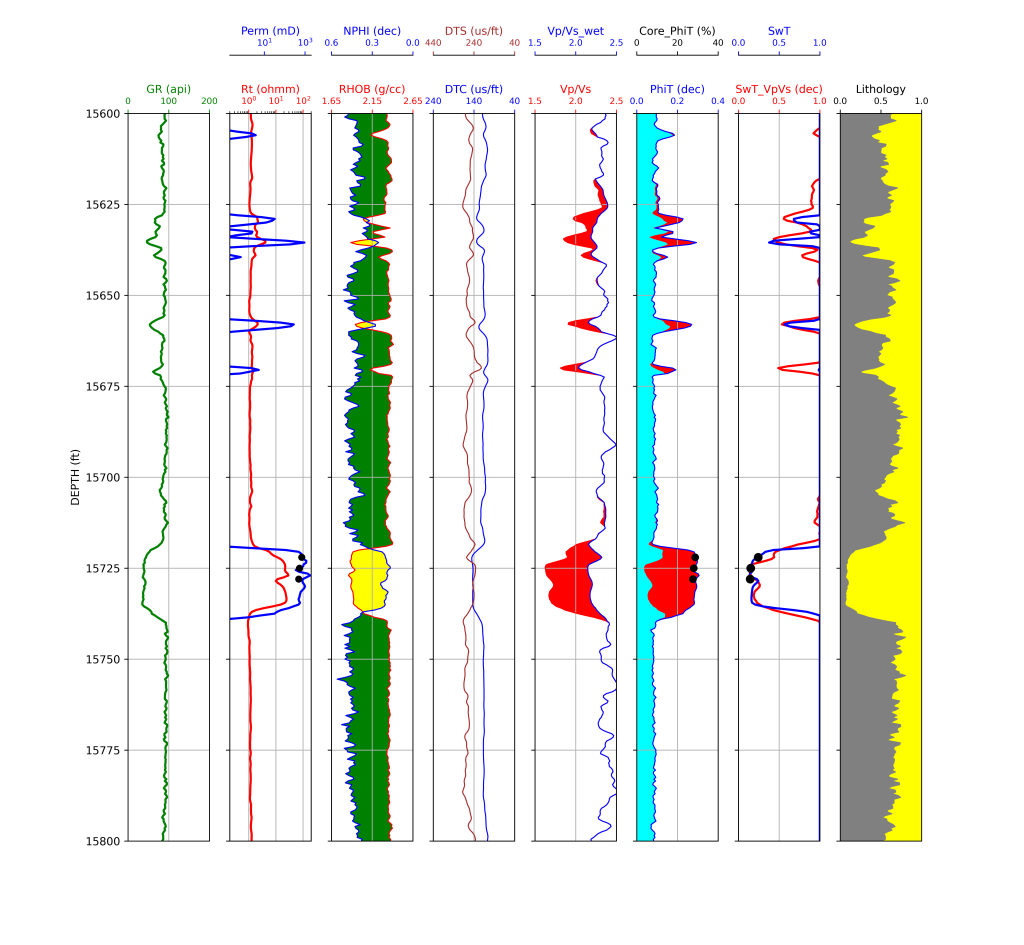
The Swt estimate from the new saturation model is the red curve labeled SWT_VpVs in the well log plot below. Once again, note how well it matches with the core Swt and Archie saturation model – the blue curve in the water saturation track. The average Swt over the reservoir interval from the new saturation model is 24.8%, compared to 21.3% for the Archie saturation model.
What is notable about this example is the implication that in the absence of a wet zone in our target reservoir, we can use a wet zone from a different reservoir several miles away within the same basin that is about the same geologic age and possibly consolidation as our target reservoir.


Let’s help you get more value out of your Sonic Logs!