Case Studies

Home > Case Studies

Overview

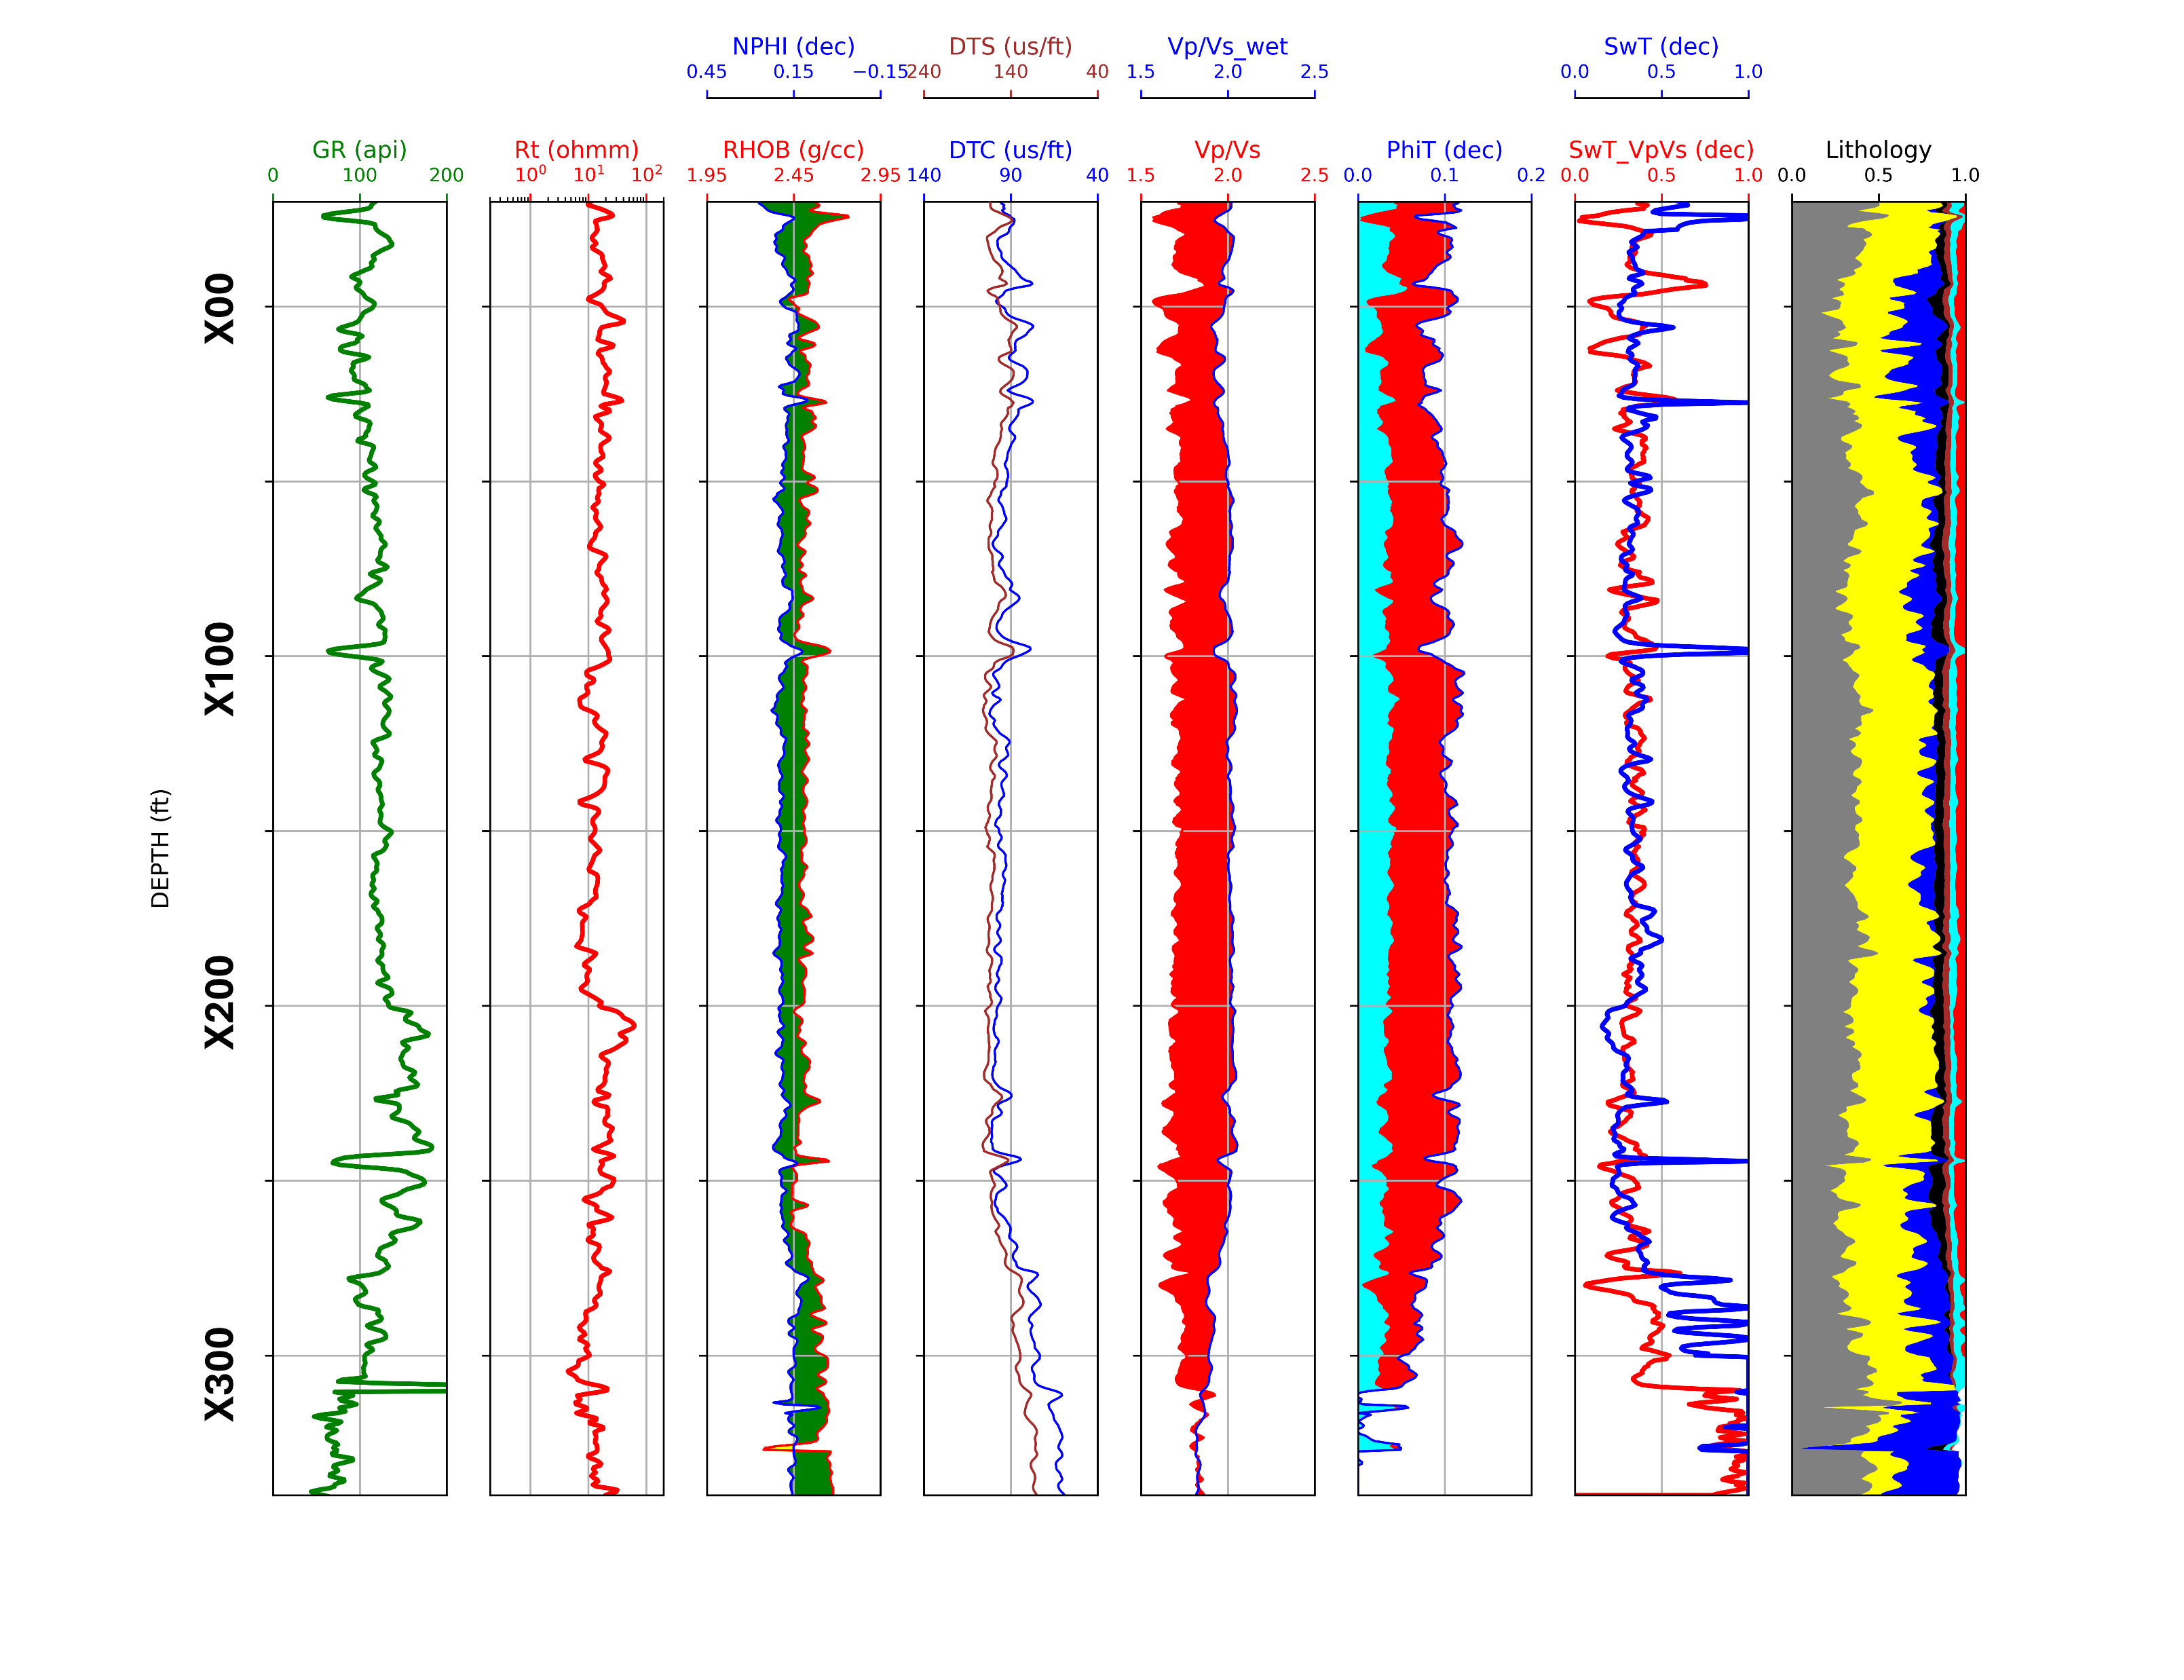
The Haynesville shale, situated in the North Louisiana salt basin and spanning across East Texas and Northwest Louisiana, is an organic shale gas reservoir dating back to the Jurassic era. The average Total Organic Carbon (TOC) within the Haynesville reservoir interval stands at 2.62 wt% based on the well log data presented below.

Description

The new saturation model is applied to the Haynesville shale dataset. The Swt estimation generated by the new model is shown in the figure below, represented by the red curve in the water saturation track. Meanwhile, the blue curve in the same track depicts Swt derived from a conventional saturation model interpretation, which has been fine-tuned to core Swt data across the primary pay interval.

Case Study Highlights:

Note how well the new model Swt agrees with the resistivity-based saturation model Swt. 

The average Swt estimate from the new model is 33%, in comparison to the 37% obtained from the resistivity-based saturation model that has been calibrated to core Swt.

The same model parameters were applied to the Haynesville published dataset of Lucier et al. (2011). The results obtained were comparable to the authors’ using a resistivity-based saturation model.
Well Log Plots

Haynesville shale well log plot

Conclusion

The new model accurately predicts water saturation in an organic gas shale reservoir with mixed lithology. Same model parameters were used on another well from a published data set. The model results were comparable to that obtained by the authors. To learn more about our methodologies and the positive impact of our work in the Haynesville Shale, please get in touch with us.

Contact Us

For further details on our methodologies, technologies, and the outcomes of this case study, please contact us.
Contact form
Accessibility Statement: We are dedicated to ensuring our content is accessible to everyone, complying with the WCAG guidelines for web accessibility.